
One big, beautiful missed opportunity
Chief Economist Eugenio J. Alemán discusses current economic conditions.
The Republicans in Congress had a unique opportunity to do things right, and they completely missed it. The One Big Beautiful Bill Act (OBBBA) is nothing but a ‘keep on borrowing today and paying back some day, but certainly not today’ politically motivated bill1. But not in the vein of Elon Musk’s criticism of the bill, which makes no sense whatsoever. According to Mr. Musk, the OBBBA is a ‘disgusting abomination’ filled with ‘pork’ because, according to him, the bill increases spending considerably. However, even if the bill has, as any politically negotiated bill does, ‘pork’ inside it, the OBBBA lowers spending. It cuts spending on many social programs favored by Democrats, especially on Medicaid, SNAP, student loans, etc. The estimate is that Medicaid spending will be cut by approximately $1 trillion during the next decade, with most of the cuts starting after the midterm election, just in case. Those are real cuts in spending, irrespective of whether you view them favorably or not.
But those are the least of the problems of the OBBBA. The problem is not that the OBBBA is not cutting government expenditures, the problem is that the proposed tax cuts, which includes the extension of the 2017 TCJA tax cuts, would bring fiscal revenues down by approximately $5 trillion on a conventional basis or by about $4 trillion if we consider economic growth during the next 10 years.2 That is, the OBBBA cuts government spending all right, contrary to what Mr. Musk argues, but the cuts in taxes and thus, cuts in expected tax revenues, are more than three times the size of the cuts in expenditures during the decade. This means that the US fiscal deficit will increase by about $3 trillion during the next decade.3 And this is just the increase in the primary deficit; it does not include the added cost of financing the increase in borrowing these deficits will incur.
So, what happened to the ‘fiscally responsible’ GOP? What happened was that it is always easier to be an opposition party than to be in power. Because when you hold power, you are the one who will be blamed. The role of opposition parties is to challenge the party that is in power. But when the opposition moves into power, they typically become what they criticize.
1In previous Weekly’s, we have advocated for proposals to pay back, in comfortable instalments per year, the monies distributed during the pandemic period by both parties, as a partial solution to the debt. But probably the easiest way to handle the fiscal deficit today was to allow the 2017 TCJA tax cuts to lapse. We know this is not politically correct, especially for Republicans, but it was the responsible thing to do.
2“One Big Beautiful Bill Act” Tax Policies: Details and Analysis, July 4, 2025, by Garret Watson, Huaqun Li, Erica York, Alex Muresianu, Alan Cole, Peter Van Ness, Alex Durante. https://taxfoundation.org/research/all/federal/big-beautiful-bill-senate-gop-tax-plan/
3What is even more interesting with the OBBB is that impact analysis studies on its effects, from right, center, and left-leaning think tanks, have similar conclusions on its effects on the deficit.
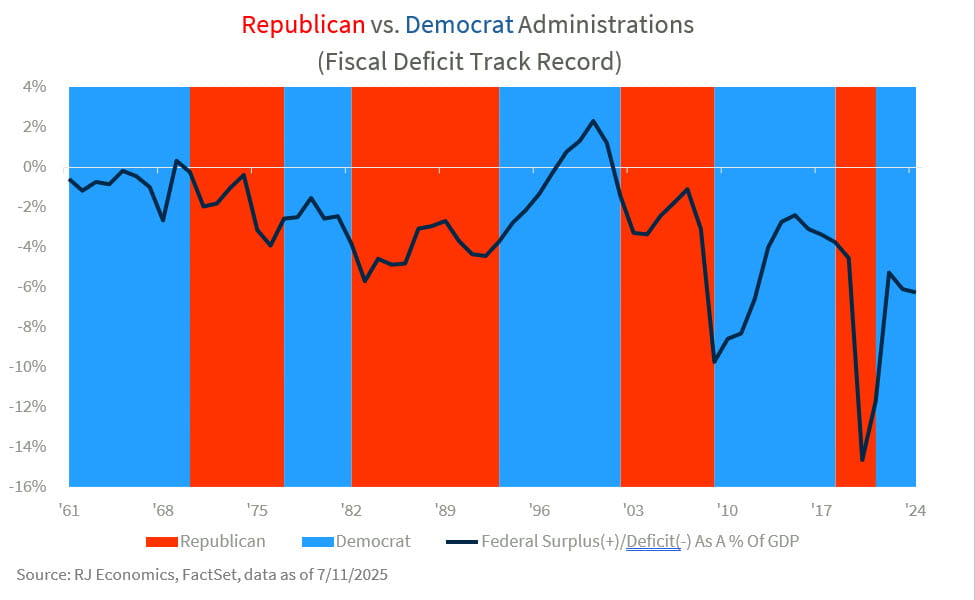
But, in the case of the Republican party, this is even worse. Democrats don’t have any issue (some would say shame!) with increasing spending and increasing taxes/tax receipts. However, Republicans have serious issues because they keep spending like Democrats but lowering taxes/tax receipts like Republicans. By the way, this is what happened during the Reagan administration, the Bush administration, and the first Trump administration, just to mention a few. This is the reason why, typically, fiscal deficits are larger, as a percentage of GDP, during Republican administrations than during Democratic administrations (see graph below). And this is what has been repeated with the OBBBA. That is, the Republicans, who argue that the US government has a spending problem, did not cut enough to make an impact on the deficit.
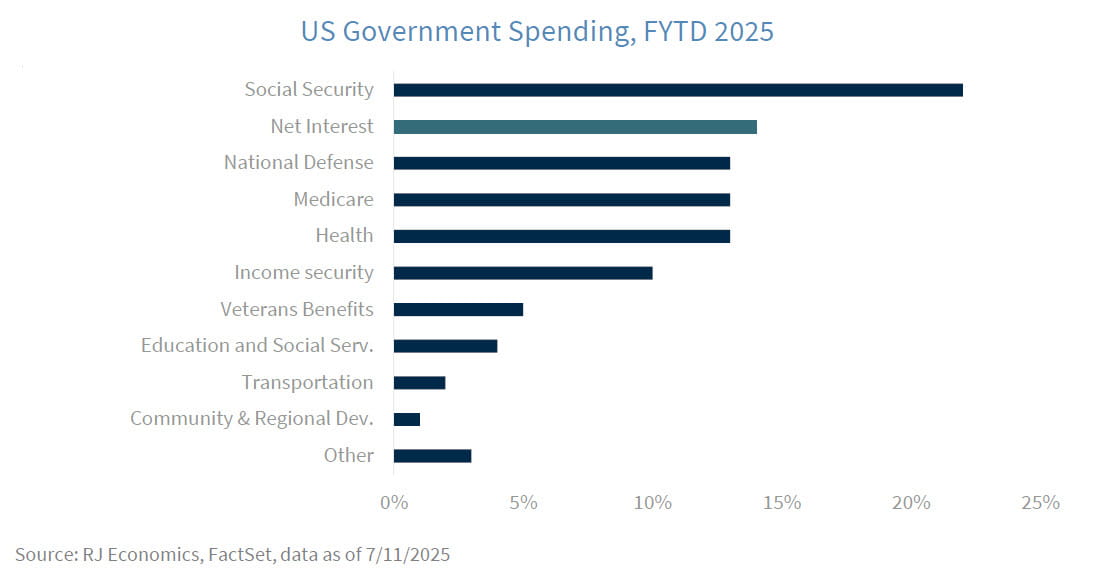
Furthermore, the fact of the matter is that Social Security, interest payments on the debt, defense spending, Medicare, and veterans’ benefits, which represent about 54% of the US federal government budget, are untouchable for Republicans as well as for Democrats. Medicaid (part of the health component in the US budget allocation graph above) and Income Security are untouchable for Democrats but not for Republicans and represent another 23% of the budget. This is what Republicans ended up cutting, plus cuts to the rest of the sectors mentioned on the graph above. However, cuts to these programs don’t do much to improve the fiscal path because they represent smaller components of spending. At the same time, lowering taxes makes the deficit problem even worse.
OBBBA is bad for deficits, what about economic growth?
Although the OBBBA is all bad news for the fiscal deficit and the sustainability of the US debt, there are some provisions that are going to be positive for economic growth, especially during the next several years, as government spending and lower taxes plus subsidies are going to occur during the first several years. However, the increase in tax revenues from higher tariffs is going to have negative effects on economic growth. Thus, the net result depends on the assumptions made when estimating these changes. The Tax Foundation, a conservative leaning think tank, estimates that the OBBBA will increase GDP slightly over the long run.
However, the Wharton Budget Model estimates that the effects on GDP will be slightly lower during the next ten years. We estimate that GDP is going to be slightly higher over the long run and more in line with the estimate from The Tax Foundation. But this slight increase in GDP will not help bring down the fiscal deficit.
Bottom line
The biggest problem with what is happening today with the political process and the OBBBA is that the longer we procrastinate addressing the unsustainable growth in the debt, that is, the more we procrastinate in bringing down the primary fiscal deficit and stabilize the growth rate of the debt, the more difficult it will be when we have no alternative or when the bond vigilantes push us to do it, as happened to Great Britain several years ago. (For more information on the US debt, take a look at our white paper).
Politics is the ‘Art of What is Possible” and Republicans, once again, when faced with what is possible and what is not, concluded that they could not lower expenses meaningfully enough to make a dent in the deficit without increasing taxes/tax receipts. But instead of facing the problem head-on, they continued to behave as Republicans, that is, spend as Democrats and cut taxes as Republicans. This is the reason why right, left, and center-leaning think tanks agreed that this strategy will increase deficits and bring us closer to the day of reckoning. It is clear that they also know that it is not possible to reduce spending in Social Security, interest payments on the debt, defense spending, Medicare, veterans’ benefits, etc., while the rest of the components of the budget are not large enough to change the trajectory of the deficits.
This would have indicated that it was time to put forward a different strategy, one that does not include continuing to lower taxes if there is no chance that they can lower expenditures meaningfully. However, it seems that they did not receive the new strategy memo!
Thus, at some point during the next decade, but hopefully well before that, we will have to take the medicine, and not even Mary Poppins will be able to sing ‘A Spoonful of Sugar’ to make the medicine go down or make it more palatable. The longer we wait to fix the trajectory of the deficit/debt, the harder it is going to be in the future. The more we wait, the more we will have to cut expenditures and/or raise taxes/tax collections in the future, putting economic growth, the US dollar, and US exceptionalism on the chopping block.
Economic and market conditions are subject to change.
Opinions are those of Investment Strategy and not necessarily those of Raymond James and are subject to change without notice. The information has been obtained from sources considered to be reliable, but we do not guarantee that the foregoing material is accurate or complete. There is no assurance any of the trends mentioned will continue or forecasts will occur. Past performance may not be indicative of future results.
Consumer Price Index is a measure of inflation compiled by the US Bureau of Labor Statistics. Currencies investing is generally considered speculative because of the significant potential for investment loss. Their markets are likely to be volatile and there may be sharp price fluctuations even during periods when prices overall are rising.
Consumer Sentiment is a consumer confidence index published monthly by the University of Michigan. The index is normalized to have a value of 100 in the first quarter of 1966. Each month at least 500 telephone interviews are conducted of a contiguous United States sample.
Personal Consumption Expenditures Price Index (PCE): The PCE is a measure of the prices that people living in the United States, or those buying on their behalf, pay for goods and services. The change in the PCE price index is known for capturing inflation (or deflation) across a wide range of consumer expenses and reflecting changes in consumer behavior.
The Consumer Confidence Index (CCI) is a survey, administered by The Conference Board, that measures how optimistic or pessimistic consumers are regarding their expected financial situation. A value above 100 signals a boost in the consumers’ confidence towards the future economic situation, as a consequence of which they are less prone to save, and more inclined to consume. The opposite applies to values under 100.
Certified Financial Planner Board of Standards Center for Financial Planning, Inc. owns and licenses the certification marks CFP®, CERTIFIED FINANCIAL PLANNER®, and CFP® (with plaque design) in the United States to Certified Financial Planner Board of Standards, Inc., which authorizes individuals who successfully complete the organization’s initial and ongoing certification requirements to use the certification marks.
Links are being provided for information purposes only. Raymond James is not affiliated with and does not endorse, authorize or sponsor any of the listed websites or their respective sponsors. Raymond James is not responsible for the content of any website or the collection or use of information regarding any website's users and/or members.
GDP Price Index: A measure of inflation in the prices of goods and services produced in the United States. The gross domestic product price index includes the prices of U.S. goods and services exported to other countries. The prices that Americans pay for imports aren't part of this index.
Employment cost Index: The Employment Cost Index (ECI) measures the change in the hourly labor cost to employers over time. The ECI uses a fixed “basket” of labor to produce a pure cost change, free from the effects of workers moving between occupations and industries and includes both the cost of wages and salaries and the cost of benefits.
US Dollar Index: The US Dollar Index is an index of the value of the United States dollar relative to a basket of foreign currencies, often referred to as a basket of U.S. trade partners' currencies. The Index goes up when the
U.S. dollar gains "strength" when compared to other currencies.
Import Price Index: The import price index measure price changes in goods or services purchased from abroad by U.S. residents (imports) and sold to foreign buyers (exports). The indexes are updated once a month by the Bureau of Labor Statistics (BLS) International Price Program (IPP).
ISM Services PMI Index: The Institute of Supply Management (ISM) Non-Manufacturing Purchasing Managers' Index (PMI) (also known as the ISM Services PMI) report on Business, a composite index is calculated as an indicator of the overall economic condition for the non-manufacturing sector.
Consumer Price Index (CPI) A consumer price index is a price index, the price of a weighted average market basket of consumer goods and services purchased by households.
Producer Price Index: A producer price index(PPI) is a price index that measures the average changes in prices received by domestic producers for their output.
Industrial production: Industrial production is a measure of output of the industrial sector of the economy. The industrial sector includes manufacturing, mining, and utilities. Although these sectors contribute only a small portion of gross domestic product, they are highly sensitive to interest rates and consumer demand.
The NAHB/Wells Fargo Housing Opportunity Index (HOI) for a given area is defined as the share of homes sold in that area that would have been affordable to a family earning the local median income, based on standard mortgage underwriting criteria.
Conference Board Coincident Economic Index: The Composite Index of Coincident Indicators is an index published by the Conference Board that provides a broad-based measurement of current economic conditions, helping economists, investors, and public policymakers to determine which phase of the business cycle the economy is currently experiencing.
Conference Board Lagging Economic Index: The Composite Index of Lagging Indicators is an index published monthly by the Conference Board, used to confirm and assess the direction of the economy's movements over recent months.
New Export Index: The PMI New export orders index allows us to track international demand for a country's goods and services on a timely, monthly, basis.
Gold is subject to the special risks associated with investing in precious metals, including but not limited to: price may be subject to wide fluctuation; the market is relatively limited; the sources are concentrated in countries that have the potential for instability; and the market is unregulated.
The Conference Board Leading Economic Index: Intended to forecast future economic activity, it is calculated from the values of ten key variables.
Source: FactSet, data as of 12/6/2024
